We can't find the internet
Attempting to reconnect
Something went wrong!
Hang in there while we get back on track
Scaling Rules

Scaling rules are a powerful tool for scaling your application using any metric you decide is best.
Scaling rules means you can do things like:
- Scale your application based on the number of web-requests per minute
- Scale your application based on the number of background jobs running
- Scale your application based on the number of jobs in a queue
- Scale your application based on the latency of a job queue
- Scale your application based... on any metric you want
Provisioning scaling rules
Scaling rules use metrics you define to autoscale your Heroku application.
To send metrics from your application to FlightFormation, we'll use your logs — so it's easy.
The first step to setting up scaling rules is to provision a log drain, it's just a button click.
Scaling rules are powered by
Here's a quick video to show how to get started provisioning scaling rules and adding a few rules.
Examples
-
Scenerio
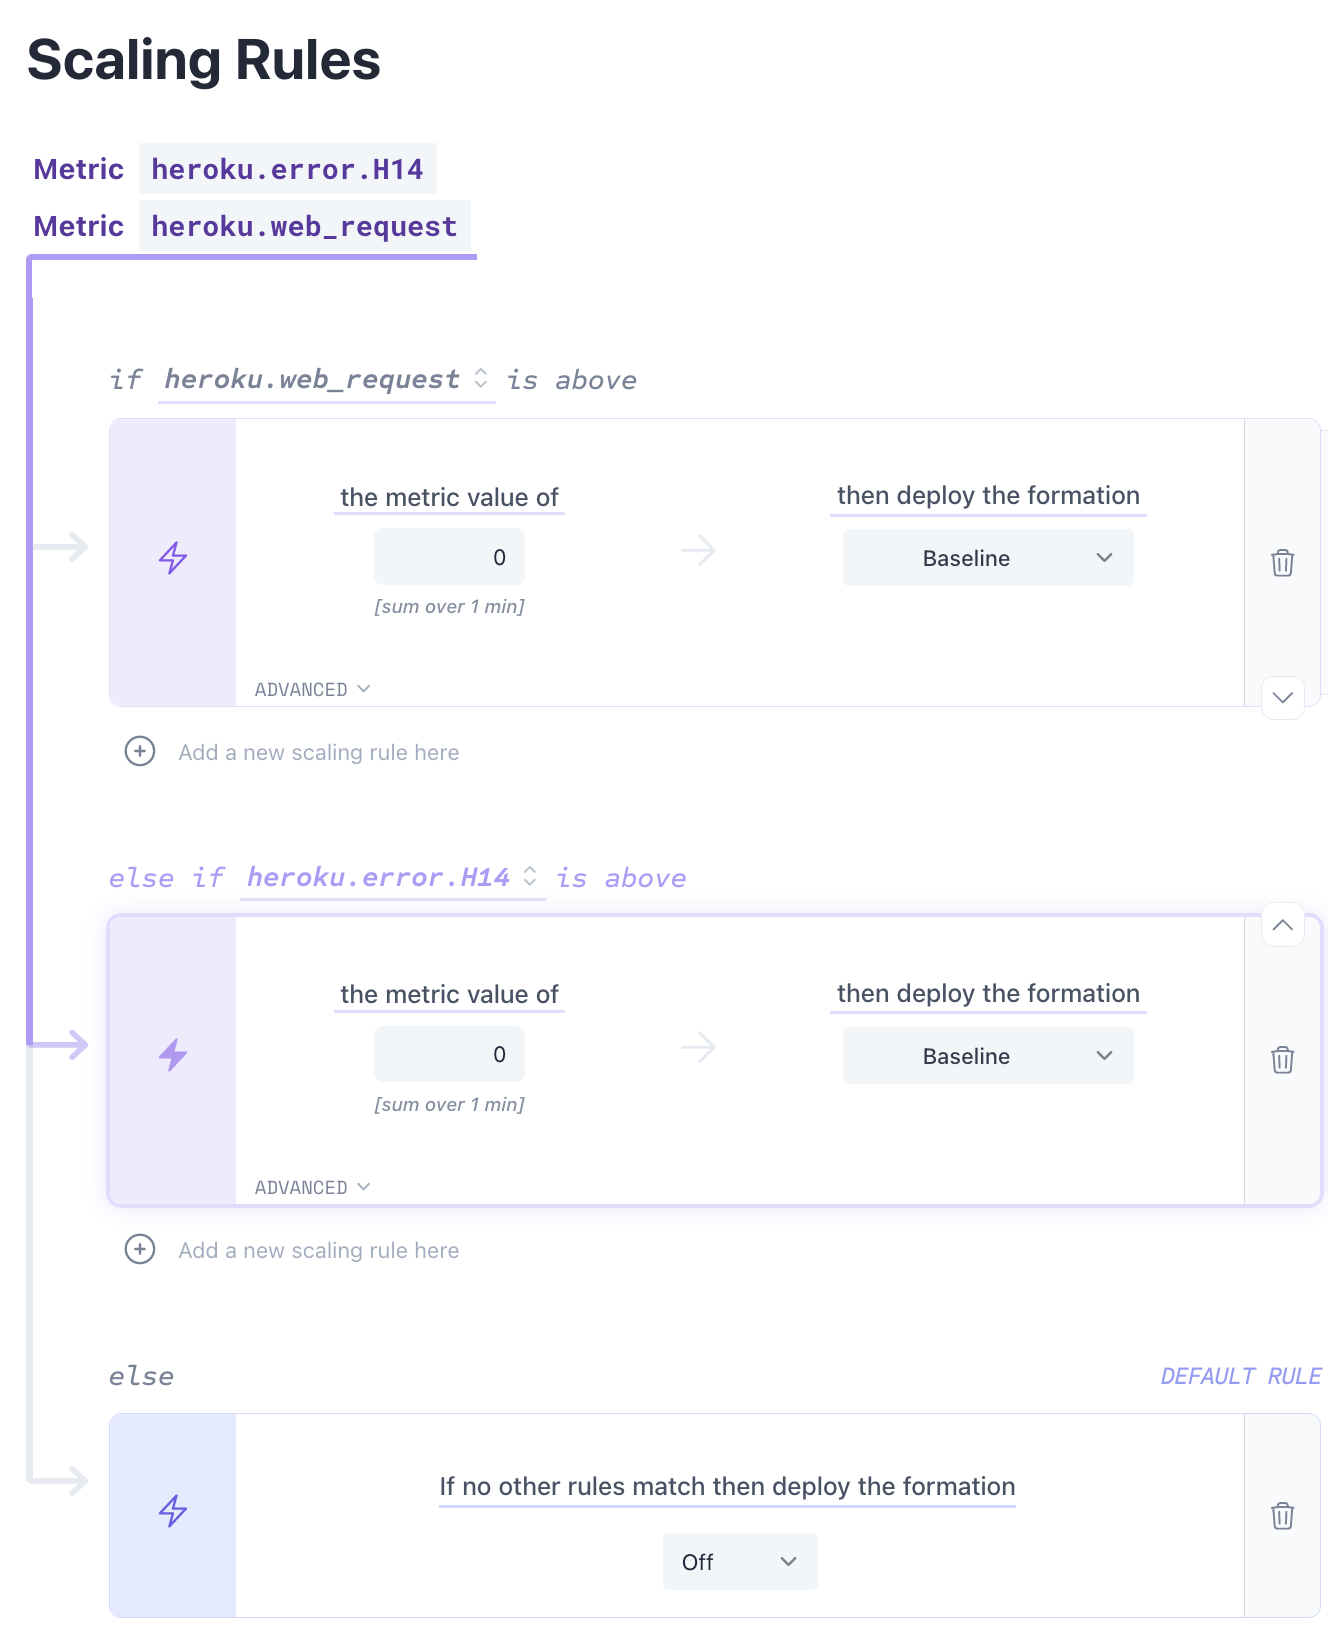
The goal here is to scale the staging application to an "Off" formation when nobody is using it. The trick is starting it back up with no web processes running. We can do this by scaling up on H14 errors. One thing to note with this solution is that the first request will show a heroku error and may take a minute or two to start up the dyno(s), usually this isn't an issue for staging applications. H14 errors on heroku are thrown when a web request is made but there are no web processes running.
Steps
- Create a scaling rule that deploys an "On" type formation when the metric heroku.error.H14 is above zero. This will start the staging app when no web processes are running and a request is made.
- Create a scaling rule that deploys the "On" formation when some metric of user activity is above zero. This will keep the staging app from shutting off again since there will not be any more H14 errors once it's running. This example uses the heroku.web_request metric.
- Create a default scaling rule that deploys an "Off" type formation.
What it looks like
-
Scenerio
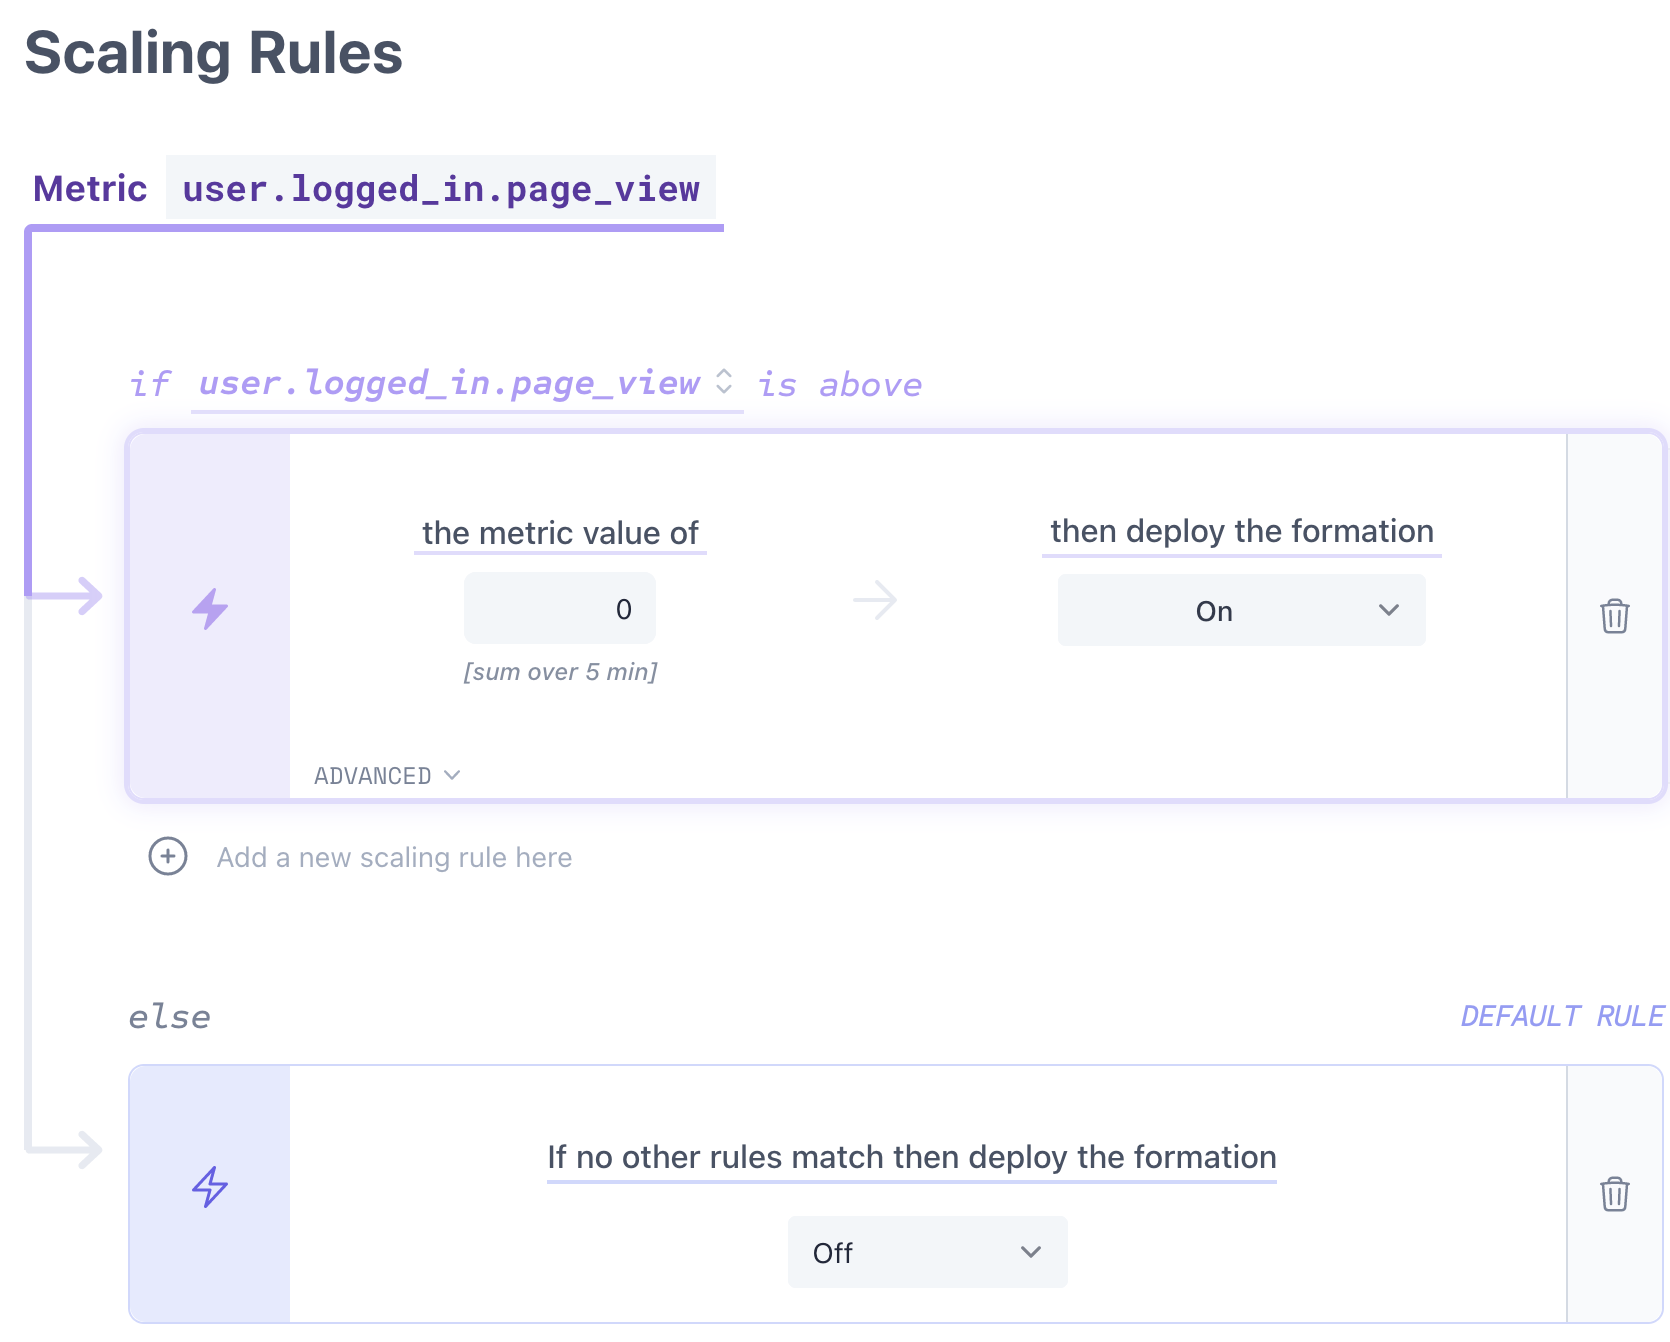
The goal here is to scale the staging application to an "Off" formation when nobody is using it. We will use an increment metric to track when the staging application is being used to scale to an "On" formation.
Steps
-
Emit a metric that indicates when your staging app is being used.
This will probably be a metric like"user.logged_in.page_view"for a web application. - Create a scaling rule that deploys an "On" type formation when the metric is above zero. For the metric above that would mean that someone is using the staging application.
- Create a default scaling rule that deploys an "Off" type formation.
What is looks like
-
Emit a metric that indicates when your staging app is being used.
-
Scenerio
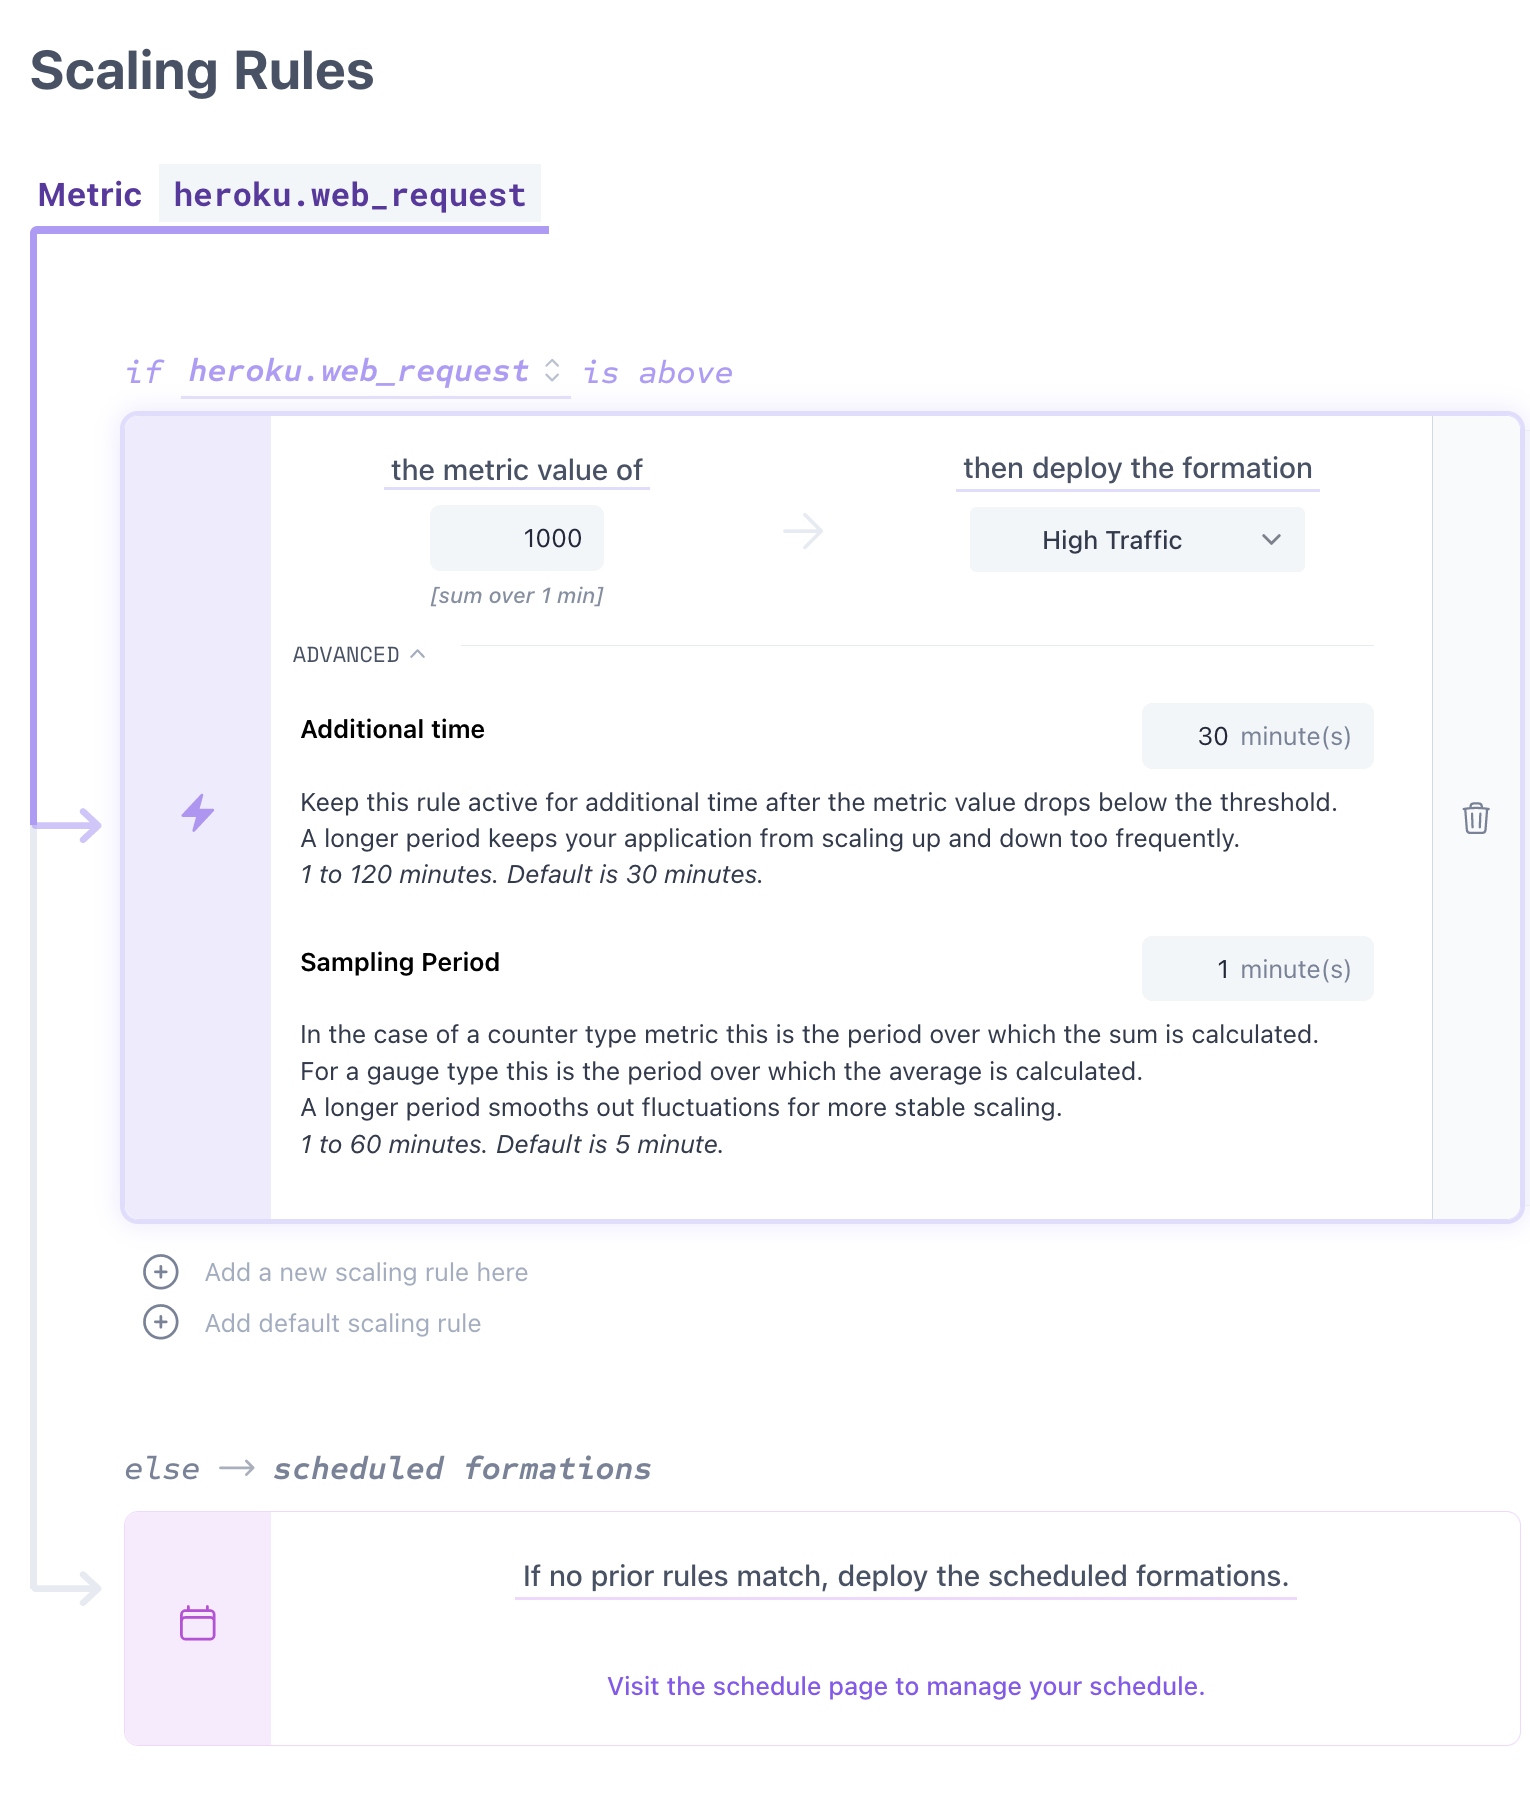
Maybe you want to scale your application to a "High Traffic" formation when you hit more than 1000 web requests in a minute, and keep it deployed for at least 30 minutes after the traffic level drops below 1000 requests per minute.
Steps
-
Add a scaling rule that deploys a "High Traffic" formation when the web request metric is above 1000.
Open the advanced options to adjust the Sampling Period to 1 minute and use the default Additional Time of 30 minutes.
What is looks like
-
Add a scaling rule that deploys a "High Traffic" formation when the web request metric is above 1000.
-
Scenerio
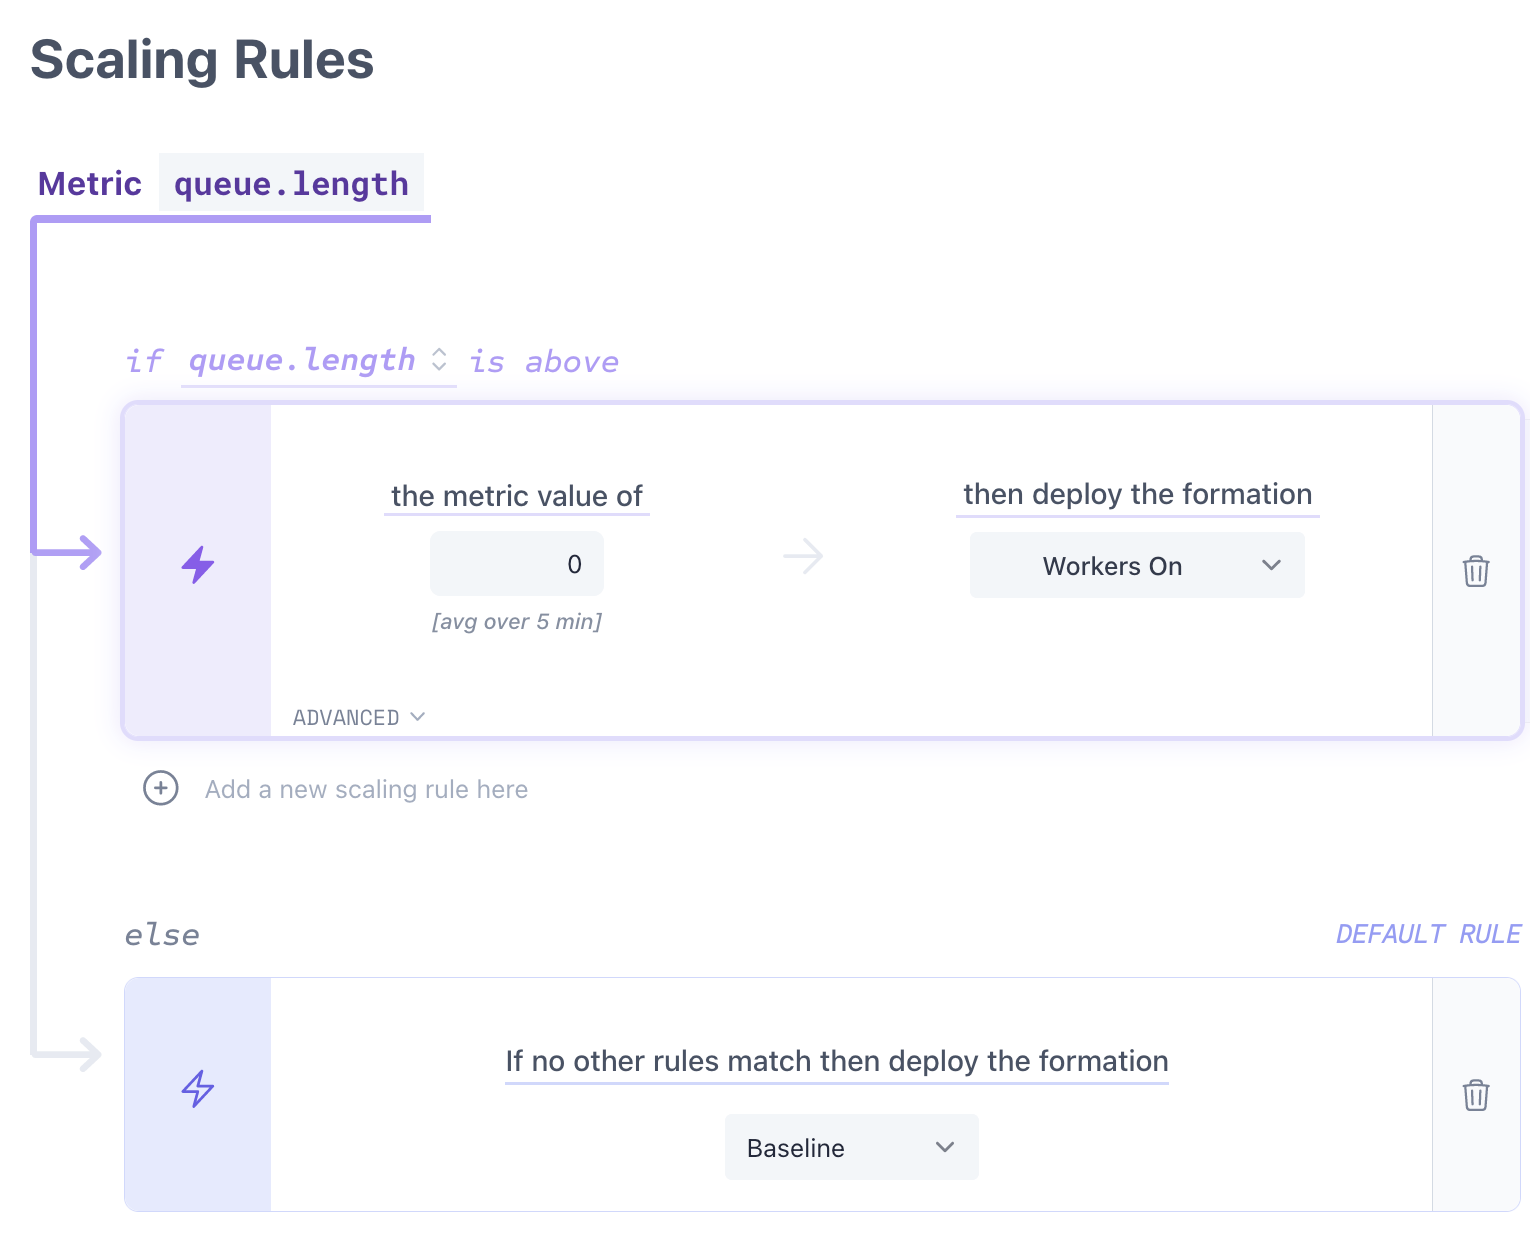
Perhaps you want to keep your "Baseline" formation deployed unless there are jobs in your background queue. In that case, you want to scale to a "Workers On" formation.
Steps
-
Emit a metric from your application that indicates when there are jobs in the queue. This could be an observation metric like
"queue.length". - Add a scaling rule that deploys a "Workers On" formation when the queue-length metric is above zero.
- Add a default scaling rule that deploys a "Baseline" formation, or allow your schedule to take over.
What is looks like
-
Emit a metric from your application that indicates when there are jobs in the queue. This could be an observation metric like
Frequently Asked Questions
-
We provide a few metrics by default that are parsed from the Heroku logs. These include:
- heroku.connect_time_ms (observation)
- heroku.service_time_ms (observation)
- heroku.web_request (increment)
- heroku.http_status.2xx (increment)
- heroku.http_status.3xx (increment)
- heroku.http_status.4xx (increment)
- heroku.http_status.5xx (increment)
If you enable runtime metrics , we can also provide the following metrics:
- heroku.load_avg.1min (observation)
- heroku.load_avg.5min (observation)
- heroku.load_avg.15min (observation)
- heroku.memory.cache (observation)
- heroku.memory.pgpgin (observation)
- heroku.memory.pgpgout (observation)
- heroku.memory.quota (observation)
- heroku.memory.rss (observation)
- heroku.memory.swap (observation)
- heroku.memory.total (observation)
-
Increment
An increment metric is used to count the number of times an event happens. It is a cumulative metric that increased over the sampling period. Use this type of metric for things like page-views, button-clicks, etc.
Observation
An observation metric is used to measure the value of something at a specific point in time. It is a snapshot of the average value at the time of the sampling period. Use this type of metric for things like memory-usage, queue-length, response-time, etc.
-
You can add custom metrics to your logs by adding a log line with a specific format.
Behind the scenes FlightFormation is using FlexLogs.com (check it out, it's another project of mine!) to parse the logs for metrics data.
Creating additional metrics is as simple as adding logging statements, here are a few examples (more coming soon):
Create an increment metric for page viewslogger.info("flightformation{metric: 'user.logged_in.page_view', type: 'increment'}")Create an observation metric for queue lengthlogger.info(`flightformation{metric: 'queue.length', value: ${ MyQueue.length() }, type: 'observation'}`) -
FlightFormation uses Heroku logs to parse metrics for scaling rules. We parse the standard Heroku metrics, but this log-based system also allows you to define custom metrics without installing anything new.
Additional information
Scaling rules are powered by Flexlogs — a log-based cloud monitoring tool (and another project of mine).